


PSEG Announces 2018 Second Quarter Results
$0.53 Per Share of Net Income
Non-GAAP Operating Earnings of $0.64 Per Share
Reaffirms Non-GAAP Operating Earnings Guidance $3.00 - $3.20 Per Share
PSEG Power Places Keys Energy Center and Sewaren 7 in Service
Progress Continues on PSEG’s $14 Billion to $17 Billion Capital Spending Program;
Supports PSE&G’s Rate Base Growth Projection of 8%-10% per year over 2018-2022
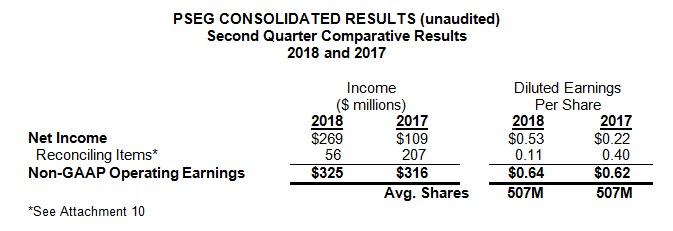
(August 1, 2018 – Newark, NJ) Public Service Enterprise Group (NYSE: PEG) reported today Net Income for the second quarter of 2018 of $269 million, or $0.53 per share as compared to Net Income of $109 million, or $0.22 per share, in the second quarter of 2017. Non-GAAP Operating Earnings for the second quarter of 2018 were $325 million, or $0.64 per share, compared to non-GAAP Operating Earnings for the second quarter of 2017 of $316 million, or $0.62 per share. Prior-year results included costs related to the early retirement of the Hudson and Mercer generating stations.
Ralph Izzo, chairman, president and chief executive officer, said “PSEG’s second quarter earnings benefited once again from expanded investment at PSE&G and ongoing focus on cost containment across PSEG. We recently reached several significant milestones, including obtaining final New Jersey Board of Public Utilities (BPU) approval of PSE&G’s $1.9 billion, 5-year Gas System Modernization Program II (GSMP II); filing the utility’s Energy Strong II infrastructure program; and completing construction of Power’s newest generating stations at Keys and Sewaren. PSEG was also an active participant as New Jersey shaped its energy policy with the enactment of a wide ranging clean energy law that sets ambitious targets on energy efficiency, off-shore wind, battery storage and renewable portfolio standards that would require use of 50% of renewable energy by 2030. Governor Murphy also signed zero emission certificate (ZEC) legislation that will help preserve the benefits nuclear generation provides to New Jersey.”
The table below provides a reconciliation of PSEG’s Net Income to non-GAAP Operating Earnings for the second quarter. See Attachment 10 for a complete list of items excluded from Net Income in the determination of non-GAAP Operating Earnings.
Ralph Izzo went on to say, “With solid financial results in the first half of 2018, we are re-affirming our non-GAAP Operating Earnings guidance for the year of $3.00 - $3.20 per share. The approval of PSE&G’s GSMP II combined with two recently outlined investment programs (Energy Strong II filed in June, and Clean Energy Future (CEF) expected to be filed later in 2018) support PSEG’s projected capital investment program of $14 billion to $17 billion over the 2018 to 2022 period. PSEG’s strong balance sheet and financial flexibility will enable funding of this expanded capital program over the 5-year period without the need to issue equity.”
The following table outlines PSEG’s expectations for non-GAAP Operating Earnings by subsidiary for 2018.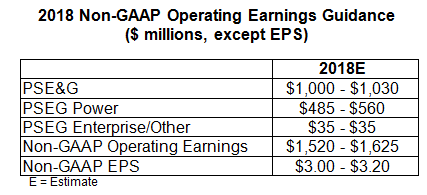
Non-GAAP Operating Earnings Review and Outlook by Operating Subsidiary
See Attachments 5 and 6 for detail regarding the second quarter and year-to-date reconciliations for each of PSEG’s businesses.
PSE&G
PSE&G reported Net Income of $231 million ($0.46 per share) for the second quarter of 2018 compared with Net Income of $208 million ($0.41 per share) for the second quarter of 2017.
PSE&G’s second quarter results reflect continued, successful execution of its infrastructure investment programs and ongoing control of operating expenses. PSE&G’s growth in Transmission investment added $0.03 per share to quarter-over-quarter Net Income comparisons. Recovery of investments made to enhance system resiliency under Energy Strong and GSMP drove improved margin comparisons of $0.02 per share. Distribution O&M savings added $0.01 per share over second quarter 2017 results. Changes to the accounting treatment of the non-service component of pension and other post-retirement benefit (OPEB) expenses resulted in a favorable $0.02 per share comparison over 2017’s second quarter. These favorable items were offset by an increase in depreciation expense of $0.01 per share, higher interest expense of $0.01 per share, and an increase in taxes and other items of $0.01 versus the second quarter of 2017.
Economic indicators for New Jersey continued to be generally positive, supported by gains in employment and housing data. Quarterly gas sales were higher, influenced by cold April temperatures. On a trailing 12-month basis, which provides longer-term trending data, weather normalized electric sales were relatively flat while gas sales were 2.7% higher, led by demand from the commercial sector. Residential electric and gas customer growth continues to trend higher at approximately 1% per year.
PSE&G received approval of its GSMP II from the BPU in May, and expects to begin this infrastructure replacement program in 2019 to invest $1.9 billion over five years. In early June, PSE&G filed with the BPU the second stage of its Energy Strong Program that proposed a $2.5 billion investment in New Jersey’s infrastructure to further strengthen the utility’s distribution systems to withstand storms, improve reliability, and significantly enhance grid resiliency and modernize an aging infrastructure.
PSE&G’s pending electric and gas distribution base rate case filed in January 2018 is progressing. PSE&G expects to provide another routine update to its filing with the BPU in August. In addition, three public hearings were recently completed, and initial testimony from the BPU staff and intervenors is expected in early August.
In support of New Jersey’s clean energy legislation enacted in late May, PSE&G continues to develop its CEF program, a $2.9 billion, six-year proposal aligned with NJ’s energy policy goals. The CEF details PSE&G’s broad range of planned investments in energy efficiency, electric vehicle infrastructure, and battery storage focused on achieving required savings in electric and gas usage in a cost efficient manner to broadly benefit our customer base.
PSE&G’s forecast of Net Income for 2018 is unchanged at $1,000 million - $1,030 million.
PSEG Power
PSEG Power reported Net Income of $41 million ($0.08 per share) for the second quarter of 2018 compared with a Net Loss of $97 million ($0.19 per share) for the second quarter of 2017. PSEG Power’s non-GAAP Operating Earnings and non-GAAP Adjusted EBITDA for the second quarter of 2018 were $83 million ($0.16 per share) and $210 million, respectively, compared to non-GAAP Operating Earnings of $97 million ($0.19 per share) and non-GAAP Adjusted EBITDA of $261 million for the second quarter of 2017.
PSEG Power’s Net Income comparison for the second quarter reflects an increase in capacity prices of $0.03 per share. Re-contracting and lower market demand reduced results by $0.08 per share compared with the second quarter of 2017. Higher gas send out in response to cold April weather added $0.01, but was offset by $0.01 per share of lower generation volume. Higher O&M expense of $0.02 per share reflects Power’s full ownership share of the Hope Creek nuclear refueling outage in Q2 2018 compared with its co-ownership share of the Salem nuclear refueling outage in Q2 2017, along with other planned fossil maintenance. Lower depreciation from cost savings associated with the early retirement of Hudson and Mercer generating stations along with lower interest added $0.01 per share versus the year-ago quarter. A reduction in the corporate tax rate from the Tax Cut and Jobs Act and other tax items improved Net Income comparisons by $0.03 per share in the second quarter.
Generation output declined by 5% compared with Q2 2017 reflecting the planned refueling at Hope Creek and other scheduled maintenance outages. Power’s gas-fired CCGT fleet operated at an average capacity factor of 46% and produced 3.5 TWh of output during the second quarter of 2018, down by 11% over the year-ago quarter, reflecting the outages and lower market demand. Coal generation output remained constant at 1.4 TWh and operated at an 81% capacity factor in the quarter. For the year-to-date period, Power’s nuclear fleet operated at an average capacity factor of 92.9%, producing 15.8 TWh representing 63% of total generation.
Power’s forecast of total output for 2018 is now slightly lower at 53 – 55 TWh from its prior estimate of 55 – 57 TWh. For the remainder of 2018, Power has hedged 90% - 95% of total forecasted production of 28 – 30 TWh at an average price of $38 per MWh. For 2019, Power has hedged 65% - 70% of forecasted production of 57 – 59 TWh at an average price of $37 per MWh. For 2020, Power has hedged 35% - 40% of output forecasted to be 62 – 64 TWh at an average price of $36 per MWh. The forecasted output for 2018 – 2020 includes generation associated with 1,300 MW of new, gas-fired combined cycle capacity at the Keys Energy Center in Maryland and Sewaren 7 in New Jersey, as well as the mid-2019 commercial start-up of the 485 MW gas-fired CCGT at Bridgeport Harbor, Connecticut.
In May, New Jersey legislation enabling zero emission certificates was signed into law by Governor Murphy in an effort to preserve the economic viability of nuclear power resources that produce over 90% of the state’s carbon free generation. The legislation calls for the BPU (within a 330-day period from enactment) to establish a collection process for a customer charge, determine eligibility and certification of need, and ultimately select nuclear plants to potentially receive ZECs starting in April 2019. The BPU will rank nuclear plant applicants based on considerations that impact fuel diversity, air quality, and other environmental attributes. Power estimates that if all of its New Jersey nuclear units are selected, it could be eligible to receive ZEC revenues of approximately $200 million per year during each 3-year cycle.
In June 2018, the Federal Energy Regulatory Commission (FERC) issued an order finding that PJM’s current capacity market is unjust and unreasonable because it allows resources supported by out-of-market payments to suppress capacity prices. FERC established a new proceeding to address an alternative approach in which PJM would: (1) modify PJM’s minimum offer price rule (MOPR) so that it would apply to new and existing resources that receive out-of-market payments, regardless of resource type; and (2) establish an option that would allow, on a resource-specific basis, resources receiving out-of-market support to be removed from the PJM capacity market, along with a commensurate amount of load, for some period of time. We intend to continue to participate in this proceeding.
In July 2018, the State of New Jersey made significant changes to its income tax laws, including imposing a temporary surtax on corporate taxable income of 2.5% effective January 1, 2018 and 2019, and 1.5% in 2020 and 2021. The surcharge provides an exemption for public utilities; as such PSE&G is not expected to be impacted by this change. For the full-year 2018, the tax surcharge is expected to have a modest negative impact on results at Power, and to a lesser extent on Enterprise/Other, as each begins to accrue the surcharge starting July 1, 2018.
The forecast of Power’s non-GAAP Operating Earnings for 2018 and non-GAAP Adjusted EBITDA remain unchanged at $485 million - $560 million and $1,075 million - $1,180 million, respectively.
PSEG Enterprise/Other
PSEG Enterprise/Other reported Net Loss of $3 million ($0.01 per share) for the second quarter of 2018 compared to a Net Loss of $2 million for the second quarter of 2017.
Non-GAAP Operating Earnings for the second quarter of 2018 were $11 million ($0.02 per share) compared to non-GAAP Operating Earnings of $11 million ($0.02 per share) in the second quarter of 2017.
The net loss for the second quarter of 2018 includes a pre-tax charge of $20 million related to ongoing liquidity challenges facing NRG REMA compared to a similar pre-tax charge of $22 million in the year-ago quarter. Results this quarter also reflect higher parent interest expense, offset by tax benefits at PSEG.
For 2018, the forecast of PSEG Enterprise/Other non-GAAP Operating Earnings remains unchanged at $35 million.
#######
About PSEG:
Public Service Enterprise Group (NYSE:PEG) is a publicly traded diversified energy company with annual revenue of $9.1 billion in 2017. Its operating subsidiaries are: Public Service Electric and Gas Company (PSE&G), PSEG Power LLC, and PSEG Long Island.
PSE&G is New Jersey’s oldest and largest regulated gas and electric delivery utility, serving nearly three-quarters of the state’s population. PSE&G is the winner of the ReliabilityOne Award for superior electric system reliability.
PSEG Power LLC is an independent power producer that generates and sells electricity in the PJM, New York and New England wholesale power markets.
Non-GAAP Financial Measures
Management uses non-GAAP Operating Earnings in its internal analysis, and in communications with investors and analysts, as a consistent measure for comparing PSEG’s financial performance to previous financial results. Non-GAAP Operating Earnings exclude the impact of returns (losses) associated with the Nuclear Decommissioning Trust (NDT), Mark-to-Market (MTM) accounting and material one-time items such as the revaluation of deferred tax liabilities and the impact of the retirement of the Hudson and Mercer coal stations on Power.
Management believes the presentation of non-GAAP Adjusted EBITDA for Power is useful to investors and other users of our financial statements in evaluating operating performance because it provides them with an additional tool to compare business performance across companies and across periods. Management also believes that non-GAAP Adjusted EBITDA is widely used by investors to measure operating performance without regard to items such as income tax expense, interest expense and depreciation and amortization, which can vary substantially from company to company depending upon, among other things, the book value of assets, capital structure and whether assets were constructed or acquired. Non-GAAP Adjusted EBITDA also allows investors and other users to assess the underlying financial performance of our fleet before management’s decision to deploy capital. Non-GAAP Adjusted EBITDA excludes the same items as our non-GAAP Operating Earnings measure as well as income tax expense, interest expense and depreciation and amortization.
See Attachments 10 and 11 for a complete list of items excluded from Net Income in the determination of non-GAAP Operating Earnings and non-GAAP Adjusted EBITDA. The presentation of non-GAAP Operating Earnings and non-GAAP Adjusted EBITDA is intended to complement, and should not be considered an alternative to the presentation of Net Income, which is an indicator of financial performance determined in accordance with GAAP. In addition, non-GAAP Operating Earnings and non-GAAP Adjusted EBITDA as presented in this release may not be comparable to similarly titled measures used by other companies.
Due to the forward looking nature of non-GAAP Operating Earnings and non-GAAP Adjusted EBITDA guidance, PSEG is unable to reconcile these non-GAAP financial measures to the most directly comparable GAAP financial measure. Management is unable to project certain reconciling items, in particular MTM and NDT gains (losses), for future periods due to market volatility.
Click here for Attachments
Forward Looking Statement
Certain of the matters discussed in this report about our and our subsidiaries’ future performance, including, without limitation, future revenues, earnings, strategies, prospects, consequences and all other statements that are not purely historical constitute “forward-looking statements” within the meaning of the Private Securities Litigation Reform Act of 1995. Such forward-looking statements are subject to risks and uncertainties, which could cause actual results to differ materially from those anticipated. Such statements are based on management’s beliefs as well as assumptions made by and information currently available to management. When used herein, the words “anticipate,” “intend,” “estimate,” “believe,” “expect,” “plan,” “should,” “hypothetical,” “potential,” “forecast,” “project,” variations of such words and similar expressions are intended to identify forward-looking statements. Factors that may cause actual results to differ are often presented with the forward-looking statements themselves. Other factors that could cause actual results to differ materially from those contemplated in any forward-looking statements made by us herein are discussed in filings we make with the United States Securities and Exchange Commission (SEC), including our Annual Report on Form 10-K and subsequent reports on Form 10-Q and Form 8-K. These factors include, but are not limited to:
- fluctuations in wholesale power and natural gas markets, including the potential impacts on the economic viability of our generation units;
- our ability to obtain adequate fuel supply;
- any inability to manage our energy obligations with available supply;
- increases in competition in wholesale energy and capacity markets;
- changes in technology related to energy generation, distribution and consumption and customer usage patterns;
- economic downturns;
- third-party credit risk relating to our sale of generation output and purchase of fuel;
- adverse performance of our decommissioning and defined benefit plan trust fund investments and changes in funding requirements;
- changes in state and federal legislation and regulations, and PSE&G’s ability to recover costs and earn returns on authorized investments;
- the impact of pending and any future rate case proceedings;
- regulatory, financial, environmental, health and safety risks associated with our ownership and operation of nuclear facilities;
- adverse changes in energy industry laws, policies and regulations, including market structures and transmission planning;
- changes in federal and state environmental regulations and enforcement;
- delays in receipt of, or an inability to receive, necessary licenses and permits;
- adverse outcomes of any legal, regulatory or other proceeding, settlement, investigation or claim applicable to us and/or the energy industry;
- changes in tax laws and regulations;
- the impact of our holding company structure on our ability to meet our corporate funding needs, service debt and pay dividends;
- lack of growth or slower growth in the number of customers or changes in customer demand;
- any inability of Power to meet its commitments under forward sale obligations;
- reliance on transmission facilities that we do not own or control and the impact on our ability to maintain adequate transmission capacity;
- any inability to successfully develop or construct generation, transmission and distribution projects;
- any equipment failures, accidents, severe weather events or other incidents that impact our ability to provide safe and reliable service to our customers;
- our inability to exercise control over the operations of generation facilities in which we do not maintain a controlling interest;
- any inability to recover the carrying amount of our long-lived assets and leveraged leases;
- any inability to maintain sufficient liquidity;
- any inability to realize anticipated tax benefits or retain tax credits;
- challenges associated with recruitment and/or retention of key executives and a qualified workforce;
- the impact of our covenants in our debt instruments on our operations; and
- the impact of acts of terrorism, cybersecurity attacks or intrusions.
All of the forward-looking statements made in this report are qualified by these cautionary statements and we cannot assure you that the results or developments anticipated by management will be realized or even if realized, will have the expected consequences to, or effects on, us or our business, prospects, financial condition, results of operations or cash flows. Readers are cautioned not to place undue reliance on these forward-looking statements in making any investment decision. Forward-looking statements made in this report apply only as of the date of this report. While we may elect to update forward-looking statements from time to time, we specifically disclaim any obligation to do so, even in light of new information or future events, unless otherwise required by applicable securities laws.
The forward-looking statements contained in this report are intended to qualify for the safe harbor provisions of Section 27A of the Securities Act of 1933, as amended, and Section 21E of the Securities Exchange Act of 1934, as amended.
From time to time, PSEG, PSE&G and PSEG Power release important information via postings on their corporate website at https://investor.pseg.com. Investors and other interested parties are encouraged to visit the corporate website to review new postings. The “Email Alerts” link at https://investor.pseg.com may be used to enroll to receive automatic email alerts and/or Really Simple Syndication (RSS) feeds regarding new postings.
